The easiest signals to work with are the time transmissions of WWV, WWVH, CHU, or other stations. These are naturally time-tagged at the source -- usually with a 1 pulse per second (1 pps) "tick". If your receiver also has a GPS-derived (or other) time marker, you can readily determine the propagation time between the transmitter and receiver.
To first order, the delay measurement can simply be made visually with an oscilloscope connected to the receiver's audio output signal with the sweep triggered by the GPS tick. However, you must also measure the RF input to AF output delay of the receiver, which can be some milliseconds.
Joe Taylor, K1JT, has developed a program called "wwv" that produces software delay solutions on a computer whose sound card input is connected to the receiver output. The program looks for a 1 pps signal from the GPS injected at the local receiver and also solves for one or more locations of the WWV (or WWVH) tick in the audio data. At times, it is possible to detect WWV at more than one delay, reflecting different propagation modes, such as 1 hop, 2 hop, etc. It is also possible to find WWVH and WWV simultaneously appearing at different delays.
The wwv software (for Windows) is available at http://www.physics.princeton.edu/pulsar/K1JT/wwv.exe with instructions at http://www.physics.princeton.edu/pulsar/K1JT/HFTOA_1.pdf.
Sample Results
The following graphs show WWV and WWVH data obtained at AA6E in Connecticut on Feb. 23-24, 2011 using the K1JT wwv program with data plotted in OpenOffice.org Spreadsheet.
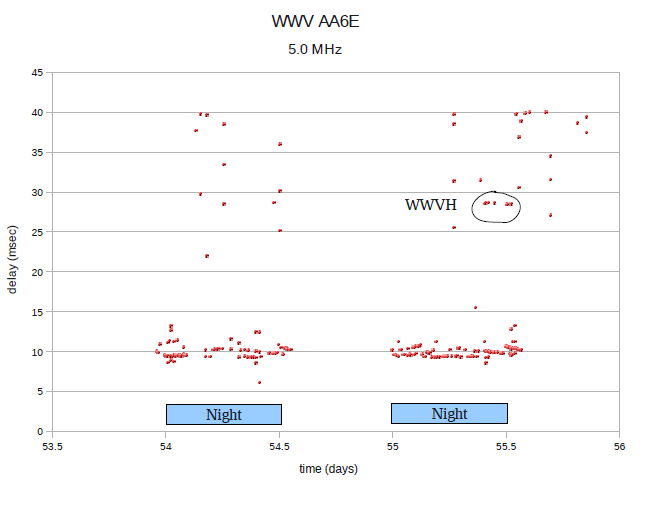
This plot shows all the delay solutions obtained over the run. (Note that the scattered points are invalid noise solutions. Good solutions fall in narrow delay ranges.) Usable signals are received only in the evenings, and WWVH makes an appearance toward morning of the second day.
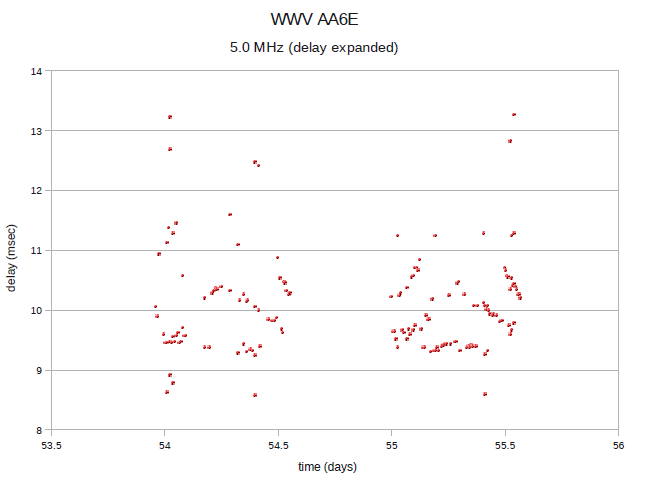
The second plot is the same data with the delay scale expanded to show information in the delays obtained from WWV. For each night, we seem to see 3 separate propagation modes, corresponding (perhaps) to 1, 2, and 3 hops between Colorado and Connecticut. [Added later: The separate delay curves may well indicate different reflection layers at different altitudes.] The delays are seen to increase as the ionosphere electron density lowers after sunset and to decrease in a symmetric fashion towards sunrise.
The complete data for this run (over all WWV frequencies) is available at http://groups.yahoo.com/group/hftoa/files/AA6E/aa6e_wwv_feb2324.pdf.